Monte Carlo Real Estate
Stress-test rental deals before you buy.
Simulate thousands of possible outcomes for rent, vacancy, and exit cap rates to understand downside risk and upside potential.
Built for real estate investors. Used to analyze rental properties, BRRRR deals, and small multifamily investments.
Simulation Count
10,000
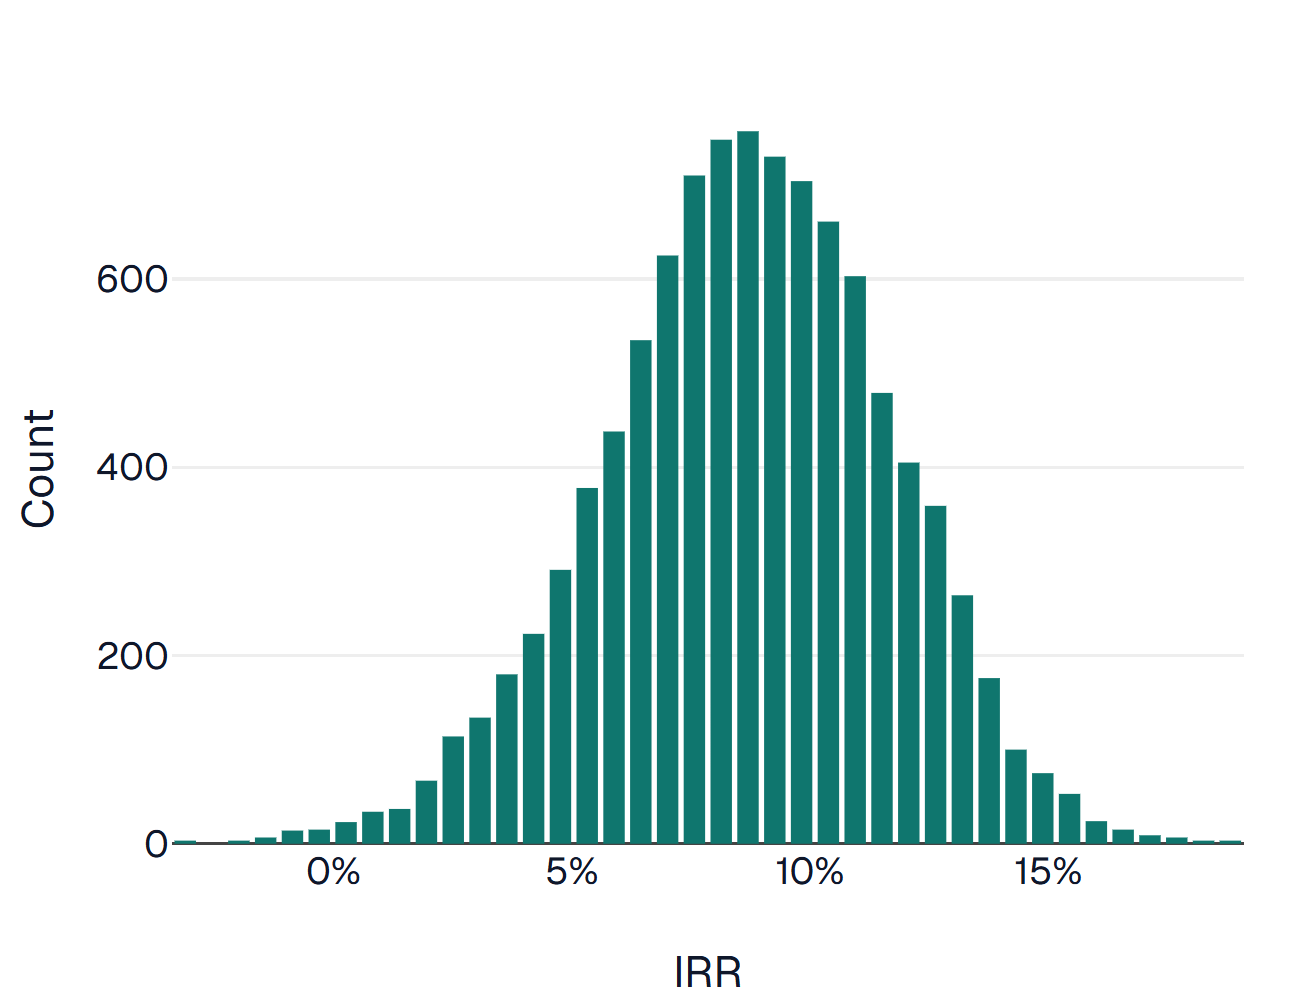
IRR Range (P10 - P90)
6% - 20%
Cash-on-Cash Range
5% - 13%
Equity Multiple (P50)
1.7x
Why spreadsheet forecasts miss investment risk
Single-point spreadsheet forecasts hide uncertainty, masking the swings that matter most before you buy.
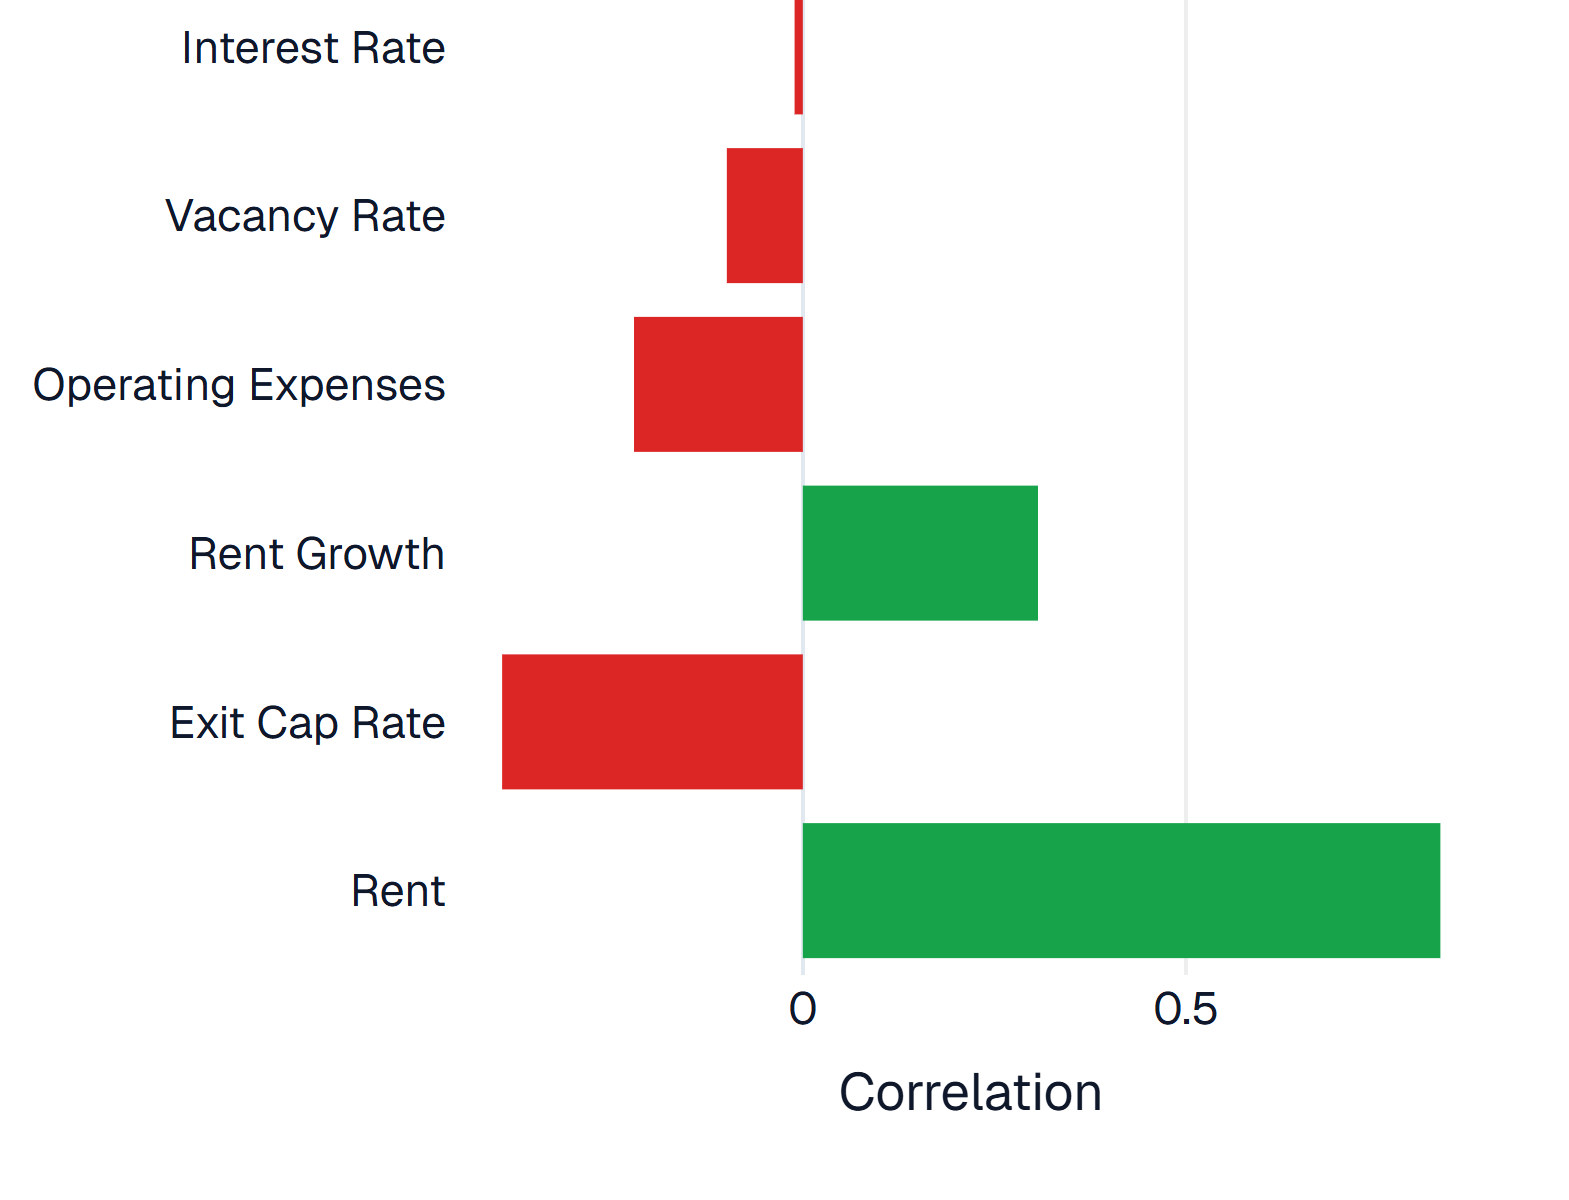
Know what actually drives your returns with the Tornado Chart risk drivers.
Single-point forecasts
Hide uncertainty.
Monte Carlo simulation
Shows the full range of outcomes.
Risk drivers
Identify what actually moves returns.
Example deal analysis
An example underwriting summary pulled directly from a simulated deal profile.
Dallas Duplex
ExampleExample: Dallas Duplex Investment
Running 10,000 simulations reveals the probability of hitting a 12% target return.
Probability IRR > 15%
61%
Probability of Loss
9%
Median IRR
14.8%
P10 IRR
6.5%
This analysis was generated by simulating thousands of possible rent, vacancy, and exit scenarios.
Visualize investment risk instantly
Preview the charts and comparisons investors use to understand distributions, downside, and trade-offs at a glance.
IRR Distribution
Risk Drivers (Tornado Chart)
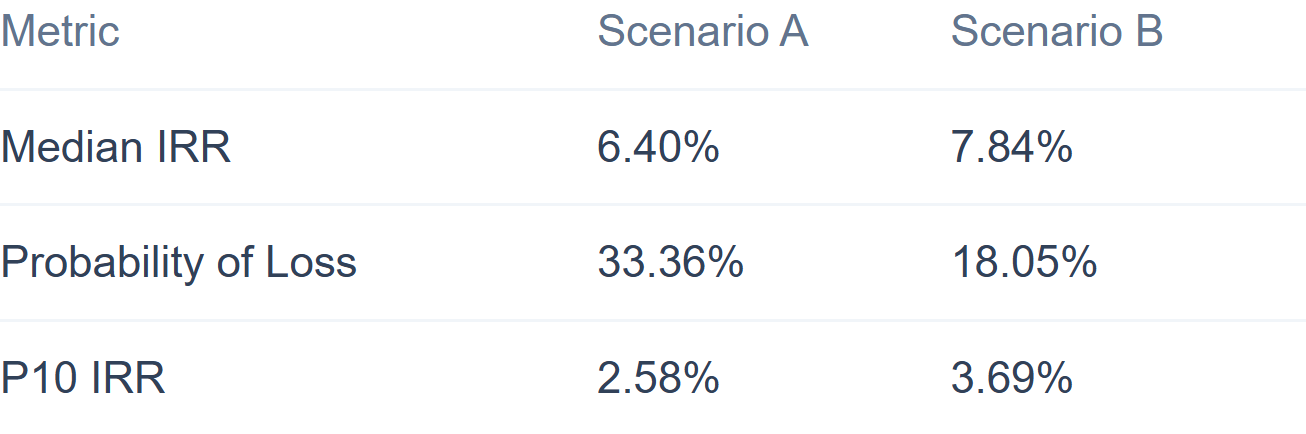
Scenario Comparison
Analyze a deal in 30 seconds
A repeatable workflow for turning uncertain inputs into confident underwriting decisions.
Step 1
Enter deal assumptions
Input rent, vacancy, operating costs, financing terms, and exit assumptions.
Step 2
Run Monte Carlo simulation
Thousands of possible outcomes are simulated using probabilistic inputs.
Step 3
Understand risk instantly
See the IRR distribution, probability of loss, and the key drivers of risk.
Analyze your next deal with probability, not guesswork.
Bring confidence to your underwriting by measuring the full distribution of outcomes before you invest.